


Quantifying Countermeasure Effectiveness
Orlando and Orange County, Florida
Source: Pedestrian and Bicycle Information Center (PBIC)
Problem
Pedestrian and bicycle professionals sometimes encounter resistance when proposing crash countermeasures, due either to competing interests along a corridor or the desire to cut costs. Quantifying the effectiveness of corridor-length countermeasures such as medians, lighting and bicycle lanes will help proponents make a better case for these elements.
Background
With the help of the University of Florida, Metroplan Orlando (the metropolitan planning organization for the Orlando-area counties of Orange, Osceola and Seminole) conducted pedestrian and bicyclist crash plotting and analysis for the years 2003 and 2004 for the entire three-county Orlando metropolitan area. All crashes were from long-form police crash reports and involved motor vehicles; they were analyzed with Pedestrian and Bicycle Crash Analysis Tool software (PBCAT; developed by the University of North Carolina Highway Safety Research Center for FHWA). From this mapping effort, high-crash corridors were identified for further study.
Solution
While knowing the numbers, locations and behaviors involved in crashes is useful, exposure data is essential when attempting to assess countermeasure effectiveness. To develop this data, Metroplan Orlando worked with Sprinkle Consulting, Inc. to select three pairs of streets for comparisons of streets with and without medians, lighting and bicycle lanes. Pairs were selected to keep other key factors comparable: number of lanes, speed, volumes, demographics, transit routes, median (for bicycle lane and lighting comparison), and lighting (for median and bicycle lane comparison). All were six-lane arterials. Three additional years of crash reports were collected, plotted and analyzed for the study streets. One hundred seventy-one reports were reviewed involving 118 bicyclist and 53 pedestrian crashes.
Sprinkle conducted site visits to note specific issues that might otherwise be missed. Of particular importance was the difference between courtesy lighting, which is generally placed on an as-needed basis at the request of businesses or residents and may leave dark gaps, and design lighting, specifically designed to effectively light the entire street. Crashes coded as "Dark, With Street Lighting" may have in fact occurred in dark gaps between lamps.
Field observation staff were recruited from local staffing agencies, trained on data collection procedures and dispatched to assigned locations. For bicyclists, observers noted these variables:
- Use of the sidewalk or roadway/bicycle lane
- Travel with or against the flow of traffic
- Equipped with headlight
- Wore a helmet
- Gender
- Estimated age.
For pedestrians, observers noted these variables:
- Crossed at intersection, midblock, or island
- Crossed through a gap or a hole
- Wore light or dark clothing.
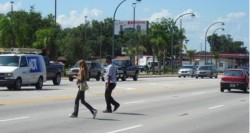
Pedestrians crossing through holes in traffic on a six-lane arterial.
Photo: Sprinkle Consulting
Most pedestrians do not cross in gaps; they cross in holes. A gap occurs when a walker can step into the roadway and reach a place of safety before any car crosses his path. A hole, on the other hand, occurs when there is traffic in the middle or far lanes in front of the pedestrian, or when a car in a near lane is so close it will pass behind the pedestrian before she completes the crossing. As long as motorists behave as the pedestrian expects, a hole crossing may be made without incident. If conditions change — for example, if a car changes lanes — the expected hole begins to close and a crash may result.
The numbers of pedestrians and bicyclists observed committing behaviors that might put them at risk was compared to the numbers of crashes resulting from comparable behaviors. The risk ratio is defined as the risk of one group divided by the risk of another group. For example, the risk ratio of riding against traffic vs. riding with traffic is simply the risk of riding against traffic divided by the risk of riding with traffic. A risk ratio greater than 1.0 means that the risk of riding against traffic exceeds the risk of riding with traffic. A risk ratio equal to 1.0 means that the risk of riding against traffic equals the risk of riding with traffic. A risk ratio less than 1.0 means that the risk of riding against traffic is less than the risk of riding with traffic.
Result
The pedestrian crash risk for crossing the arterial without a median was 6.48 times higher than for crossing the arterial with a median. The risk for crossing the arterial without lighting was 1.66 times higher than for crossing the arterial with lighting.
Findings for the bicycle lane comparison were problematic. Both study streets serve colleges (the University of Central Florida [UCF] and Full Sail, a video arts school), but initial counts were conducted after students had left in the spring. A subsequent count was conducted for the UCF corridor in the fall, but these numbers were not included in the final report currently available on-line. For the initial count, only 2.5 percent of cyclists (one out of 39) was observed using the bicycle lane. During the combined initial and follow-up counts 15 percent (24 of 162) were in the bicycle lane. While there were two wrong-way-in-the-bicycle-lane crashes recorded during the five years of crash reports, no such behavior was observed in any of 162 cyclists.
Cycling against the flow of traffic (sidewalk or roadway) was found to be 4.4 times riskier than traveling with the flow. Cycling on the sidewalk (with or against the flow) was found to be 1.6 times riskier than on the roadway, but this is largely attributable to the high number of sidewalk cyclists traveling against the flow.
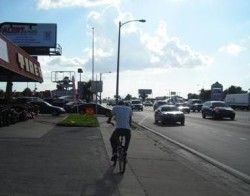
A bicyclist traveling on the sidewalk against the flow.
Photo: Sprinkle Consulting
When the additional counts for the UCF corridor are included, the ratio of crashes to observed cyclists is 0.05 for sidewalk/with the flow, and 0.08 for bicycle lane/with the flow. It should be noted, however, that there were only four sidewalk/with the flow crashes and only two bicycle lane/with the flow crashes (compared to 17 sidewalk/against the flow), and that none of the bicycle lane crashes involved overtaking motorists. Area-wide, there were only 13 crashes (1.5 percent of 885) involving law-abiding cyclists on over 350 miles of bicycle lanes or paved shoulders.
The report made these recommendations:
- Install medians whenever feasible as part of new roadway construction and as part of roadway reconstruction.
- Add lighting to both sides of the street. Eliminate dark gaps with appropriate longitudinal spacing. On divided roadways, consider street lights in the median to properly illuminate the middle of the roadway.
- Designate bicycle lanes with pavement markings and signs so that more bicyclists will recognize them as an area of the roadway set aside for cyclists, and to indicate cyclists are to ride with the flow of traffic.
- Implement educational countermeasures to assure that everyone knows how to and does bicycle safely.
Cost
For the initial mapping study and crash analysis study, the University of Florida mapping portion was funded by the Florida Department of Transportation as part of an on-going crash mapping project focused on high-crash counties. PBCAT analysis was conducted in-house by Metroplan Orlando. The contract for field counts, observations and analysis was $6,000. More money should have been allocated for more observation time along more corridors, particularly for the bicycle lane study.
Web sites
Countermeasures Report: Pedestrian and Bicycle Crash Plotting and Counts and Behaviors Observations http://www.metroplanorlando.com/site/upload/documents/ped_and_bike_risks_and_countermeasures.pdf
Countermeasures Report Appendix (contains aerial photos of study streets, GIS maps of crashes, crash summaries and data collection instruments)
http://www.metroplanorlando.com/site/upload/documents/ped_and_bike_risks_appendix.pdf
Orlando Area Bicyclist Crash Study: A Role-Based Approach to Crash Countermeasures; A study of bicyclist-motorist crashes in the Orlando urban area in 2003 and 2004
http://www.metroplanorlando.com/site/upload/documents/Bicyclist_Crash_Study_OrlandoArea.pdf
PBCAT: http://www.pedbikeinfo.org/pbcat_us/
Contact
Mighk Wilson, Smart Growth Planner
Metroplan Orlando
315 East Robinson Street, Suite 355
Orlando, FL 32801-1949
(407) 481-5672 ext. 318
mwilson@metroplanorlando.com
www.metroplanorlando.com
Theodore A. Petritsch, P.E., PTOE
Senior Transportation Engineer
Sprinkle Consulting, Inc.
18115 U.S. Hwy 41 N, Suite 600
Lutz, FL 33549
(813) 949-7449
tap@sprinkleconsulting.com
Image sources
Sprinkle Consulting